Den hab ich aber nicht erfunden sondern man kann Ihn in dieser wissenschaftlichen WEB-Site nachlesen:
THE DEATH KNELL FOR THE CO2 THEORY
he death knell tolls for the Carbon Dioxide Greenhouse Gas Theory (CO2-GHT). If the CO2-GHT ever was a plausible theory, it is rapidly turning into a giant hoax. The perceived scientific underpinnings of the theory are unravelling fast. It took a while to get the "Anti-CO2-Warmist-Theory" scientific camp on the right footing. Now, Principia Scientific Intl. (PSI) has taken the lead in dispelling the last of the CO2-GHT "consensus"-based vestiges.
The latest nail for the CO2-GHT coffin has been contributed by Dr. Charles R. Anderson with his article "The Most Essential Physics of the Earth's Temperature and Why Carbon Dioxide is No Threat to the Earth." This comes hard on the heels of a recent paper on "The phase relation between atmospheric carbon dioxide and global temperature" by Dr. Ole Humlum and coworkers. Their work showed conclusively that the regular seasonal variations in the atmospheric CO2 levels are lagging the sea surface temperatures by 9.5 to 12 months — not the other way.
Er bezieht sich hierbei auf:
So has the recent increase in atmospheric CO2 preceded or followed the recent increase in temperature? A relatively recent paper by Humlum, Stordahl, and Solheim entitled The phase relation between atmospheric carbon dioxide and global temperature published in Global and Planetary Change, Vol. 100, January 2013, p. 51-69 answers this question.
Wer sich für die wissenschaftlichen Details interessiert, lest euch das mal durch.
DA steht ERSTAUNLICHES was hierzulande im Meinungsmanipulierten TV nicht gezeigt wird. Höchstens mal nach 23:00 Uhr auf ARTE oder irgendeinem Lokalsender.
Das ist das Meinungsvielfalt-Feigenblatt der aktuellen Medienlandschaft.
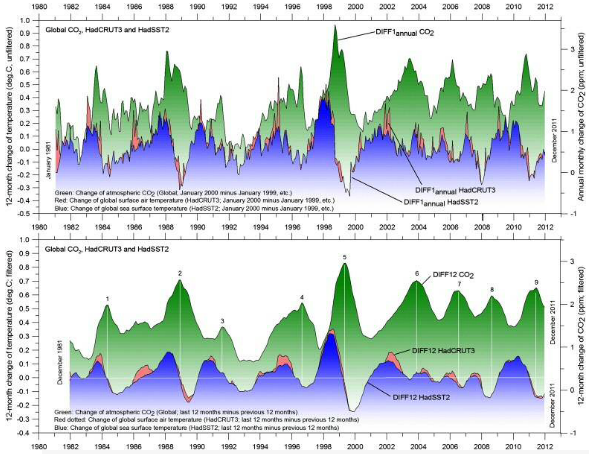
Figure 1. The upper panel plots the 12-month change in CO2 (NOAA, green) for each month minus that same month 12 months earlier compared to the same 12-month change in sea surface temperature (HadSST2, blue) and the 12-month change in global surface air temperature (HadCRUT3, red). The lower graph plots the difference of a 12-month average with the previous 12-month average for the same CO2 concentration, sea surface temperature, and global surface air temperature series. It is clear that the changes in CO2 come after the changes in temperatures.


